When it comes to determining the success of a business, there are various factors to consider. Financial health aspects, such as profitability and operating efficiency, naturally come to mind first. However, experts connect those factors to another one - customer happiness.
“Companies that prioritize customer satisfaction tend to have a more loyal customer base, which can translate to long-term profitability,” a panel of experts recently said in a recent examination of customer support strategies published by Forbes magazine. It shows that focusing on customers pays off with increased customer loyalty, expanded referral networks, and, ultimately, higher profits. That is why customer service benchmarks play a crucial role in determining company performance. Measuring this customer service Key Performance Indicators (KPIs) facilitates the creation of a growth strategy for a business.
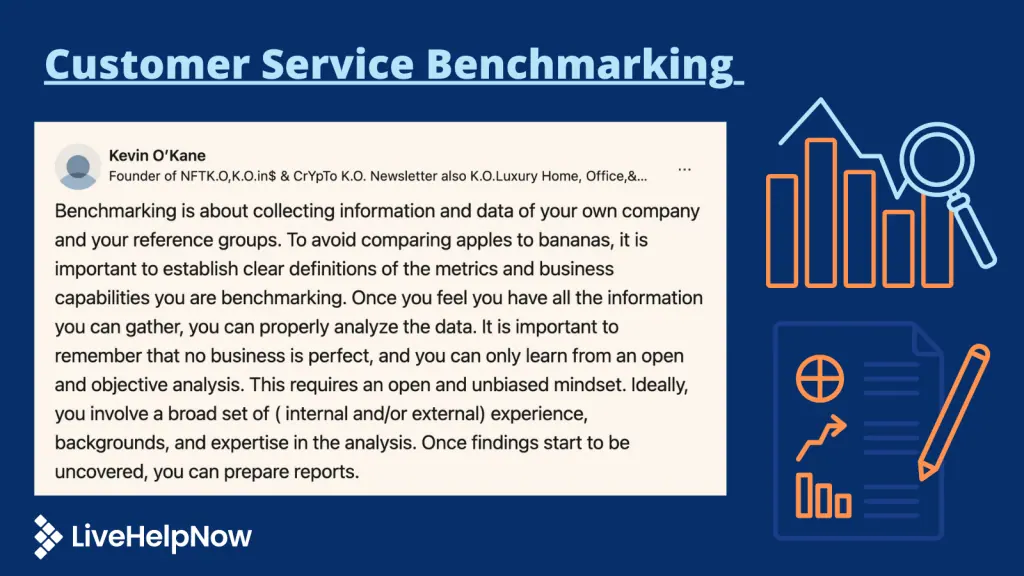
How to Benchmark Customer Service
The first step in customer experience benchmarking involves defining metrics that reflect the quality and standards of customer service a company provides. Aligning the benchmarks with overall company objectives, industry norms, and customer feedback can help determine further strategy.
Why is customer service benchmarking important?
The measurable metrics provide insights into how customers perceive products, services, or interactions. They show the business what works and what needs improvement. Then, once further steps bring changes, the new metrics demonstrate the effectiveness of a customer service strategy.
Choosing which metric to track depends on the business. Below are some of the most common ones that provide a snapshot of customer support effectiveness.
Customer Service Benchmarks to Track
1. Response Time
One of the most essential of the customer satisfaction benchmarks is speed. This is measured by how quickly agents get customers help and respond to their queries and complaints. A quick and efficient response time shows that your business values its customers and their time. It’s a measure of respect for customer time, one of the psychological principles that fuel customer experience.
To calculate an average response time use the following formula.
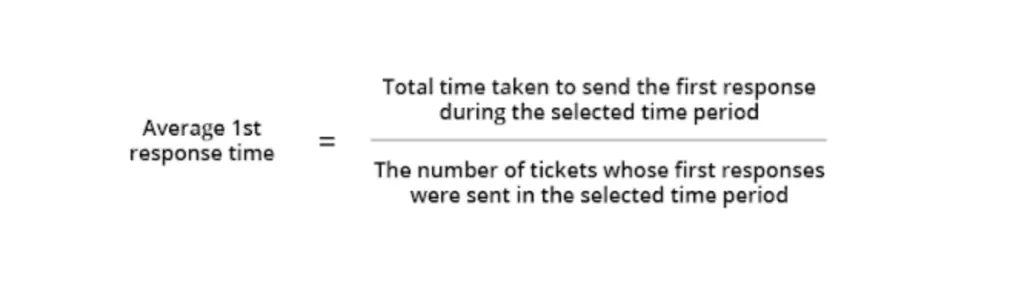
When it comes to customer response time standards, they, of course, differ based on the type of customer support channel. For example, emails generally average response time between 12 to 24 hours. A response to live chat, on the other hand, should not be more than 3-5 minutes.
2. First Contact Resolution (FCR)
Making a customer wait for a response plants a seed of frustration. It starts when a customer repeatedly contacts the company to resolve an issue. Soon that frustration grows into an unsatisfied customer.
FCR measures the ability of customer service agents to resolve issues during the first interaction with a customer. High FCR rates indicate effective problem-solving skills and a focus on providing satisfactory solutions promptly. No two companies’ FCR goals will be the same. Two call centers serving different industries will have different ideal FCR rates, depending on their structure, staffing, channel availability, and workload.
To calculate the FCR, divide the number of cases resolved on the first contact by the number of cases handled by agents in total. To get a percentage, multiply the number by 100. For example, if agents resolved 150 calls out of 400 on the first contact, the FCR rate is 37.5%.
3. Customer Satisfaction (CSAT) Score
This benchmark measures how satisfied customers are with the service they receive. CSAT surveys or feedback can help gauge overall customer happiness, identify areas for improvement, and assess the quality of customer service.
A recent Forbes study revealed that companies that put in the effort to take their customer experience from average to awesome saw a 30-50% increase in the likelihood of the customer recommending the product or services to other consumers.
There are a number of ways to track customer satisfaction, but the most common way is by way of after-call surveys. They can deliver quantitative or qualitative measurements of customer satisfaction, depending on the format of the survey. Finding the best way to measure CSAT benchmarks for a specific company can help determine the average CSAT score base point for a customer service department. This can effectively help support an organization and ensure excellent customer service in the future.
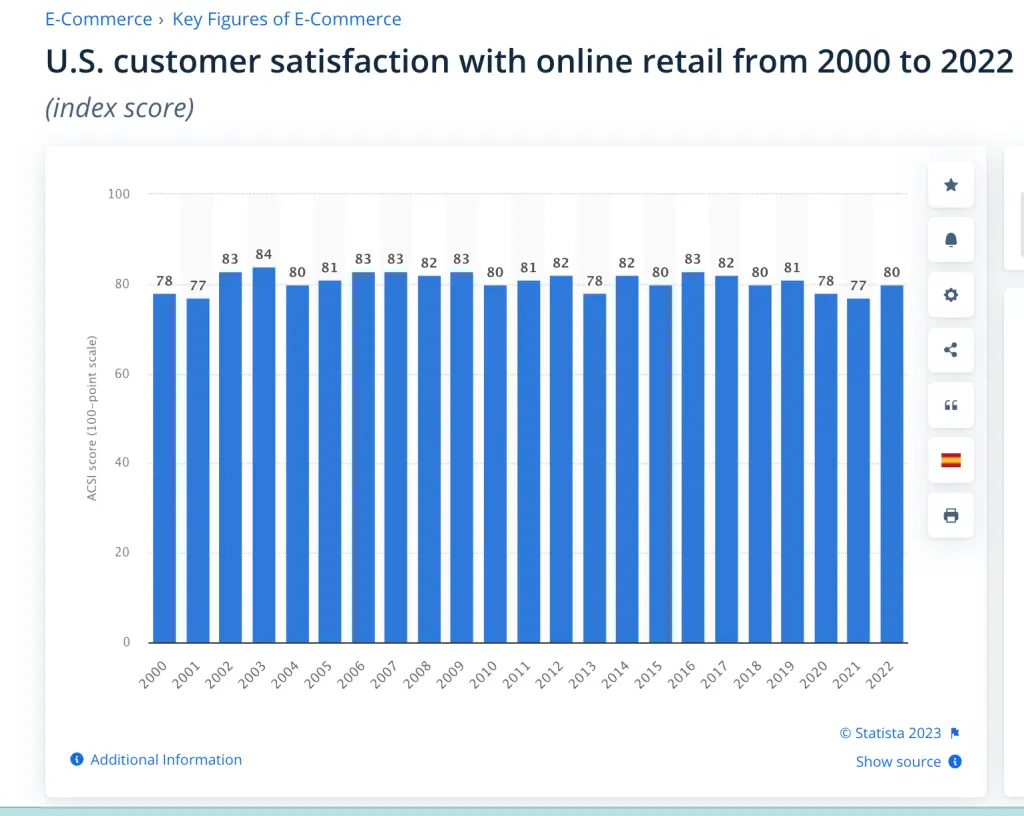
The American Customer Satisfaction Index (ACSI) provides a similar metric of customer satisfaction. It is calculated as a weighted average of three survey questions that measure different facets of satisfaction with a product or service. ACSI researchers use proprietary software technology and a patented system to estimate the weighting for each question.
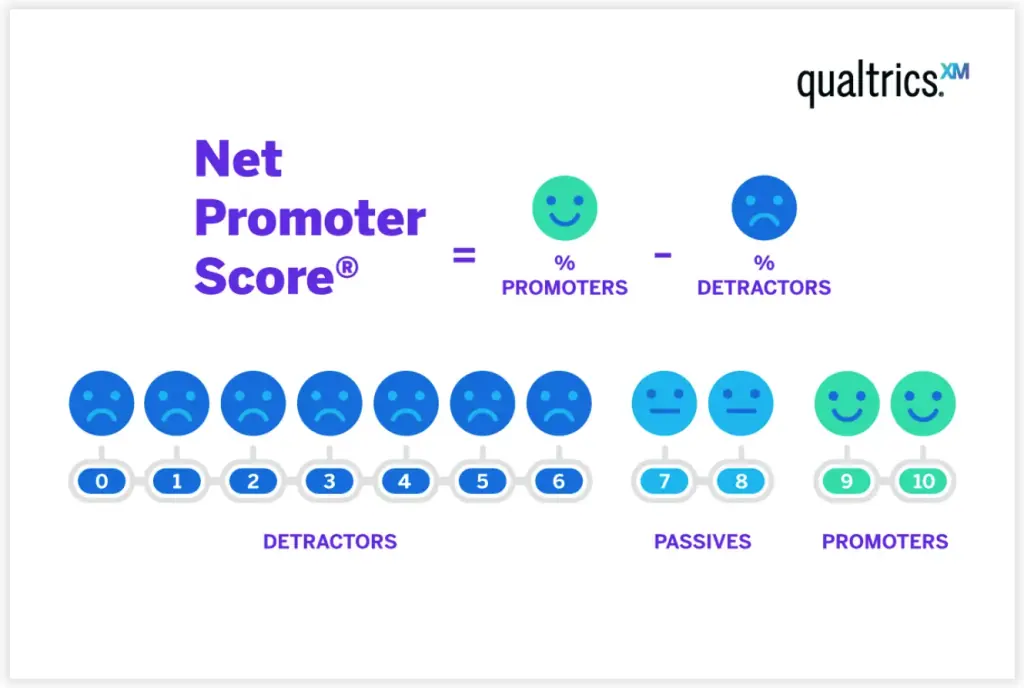
4. Net Promoter Score (NPS)
NPS survey measures customer loyalty by asking survey participants, "How likely are you to recommend our company to a friend?" It helps identify brand advocates and overall customer sentiment throughout the customer journey. A higher NPS indicates customer satisfaction and the potential for positive word-of-mouth referrals.
To calculate the score, subtract the percentage of people who would not recommend your brand from the percentage of people who would.
5. Customer Retention Rate (CRR)
This metric measures the percentage of customers who continue to do business with your company over a specific period of time. A high CRR implies successful customer service, excellent product quality, and overall customer satisfaction. Customer retention is an important metric. Retaining an existing customer is always cheaper than gaining a new one. So it’s in a company’s best interest to understand and monitor customer loyalty.
To calculate the customer retention rate, use this formula: [(E-N)/S] x 100 = CRR.
Subtract the number of new customers gained over a period of time (N) from the number of customers at the end of that period of time (E). Then, divide that number by the number of customers in the beginning of the period (S). Multiply by 100 to get CRR measured in percentage. For example, if a company had 100 customers at the start of the period (S), ended the period with 100 customers (E), and added 10 customers over the period (N). The CRR is 90 percent: [(100-10)/100] x 100 = 90 percent.
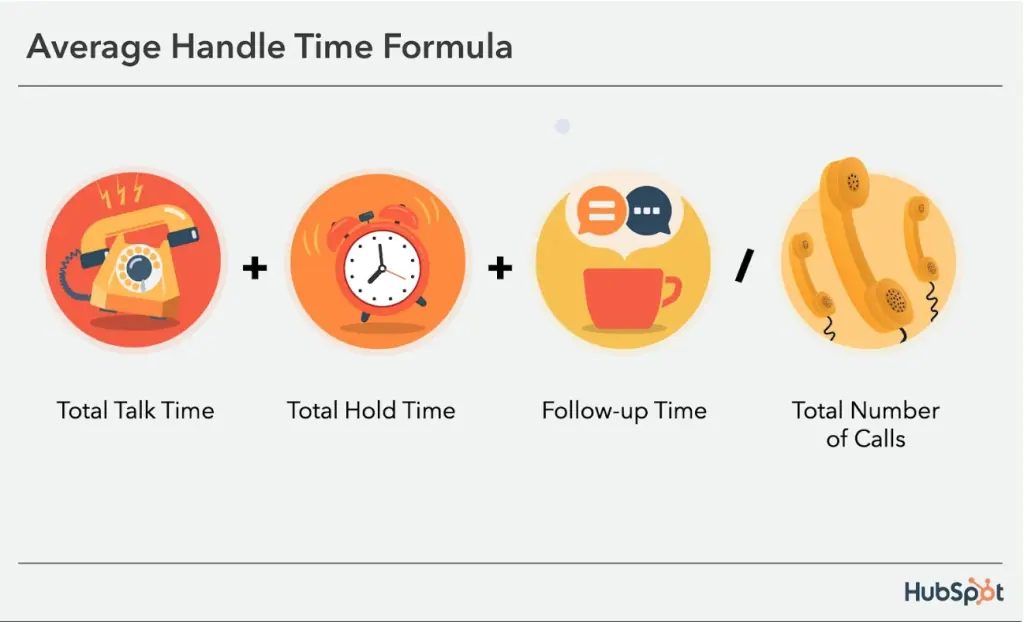
6. Average Handling Time (AHT)
AHT calculates the average time taken to resolve a customer inquiry or issue. It helps assess the efficiency of customer service agents and processes. This customer service benchmark can point out operational faults in need of attention. A lower AHT generally indicates the need for more streamlined operations and quicker issue resolution.
To calculate AHT for a phone channel, divide the sum of your total talk, hold, and follow-up time by your total number of calls. Follow-up time includes the time it takes to get back to a customer if the case isn’t resolved on the initial call or chat. For chat, add your total amount of chat and follow-up time, then divide that number by your total number of chats. For web and email tickets, add the total amount of time spent on each case and divide it by your total number of cases. (HubSpot)
7. Customer Effort Score (CES)
"When it comes to service, companies create loyal customers primarily by helping them solve their problems quickly and easily." (Harvard Business Review)
The least effort a customer must put into the support experience, the better. CES measures the ease with which customers can get their problems resolved. It focuses on minimizing the effort required from the customer's end to receive adequate support. A lower CES demonstrates that a company prioritizes simplicity and ease of use.
Customer satisfaction surveys present a way to collect data after a recent support interaction. Whichever style of CES questionnaire a company selects will determine the scoring.
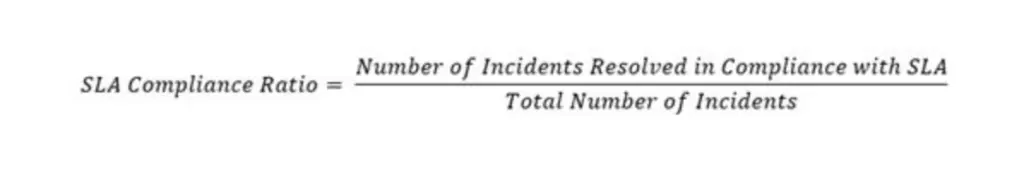
8. Service Level Agreement (SLA) Compliance
SLA compliance measures the percentage of customer service requests or issues resolved within the agreed-upon time frame. Meeting or exceeding SLA targets ensures that customers receive timely assistance and helps build trust and reliability.
9. Time to Resolution (TTR)
This benchmark tracks the average time taken to resolve customer issues from the moment they are reported or requested. Efficiently resolving issues within a reasonable timeframe demonstrates effective problem-solving skills and customer-centricity. This can also help determine a contact center’s operational efficiency. Knowing how long specific issues take to resolve and what type of manpower it requires guides a company’s staffing strategy.
To calculate TTR, choose a time range and add up all the resolution times for each one of the customer conversations. Calculating separate TTRs for different channels provides a more accurate and useful measurement. Live chat support resolution time will differ drastically for customer service emails, for example. Finally, divide the total time for all resolutions by the number of inquiries.
10. Employee Satisfaction
Last, but definitely not least on the list of customer service benchmarks, employee satisfaction plays an important role. Content and engaged employees are more likely to provide better service, creating a positive and welcoming atmosphere for customers. Happy employees result in happy customers.
Companies can encourage employee engagement through various positive workplace strategies. Companies like Trader Joe's demonstrate how high employee satisfaction acts as a competitive differentiator among top performers. In fact, a higher score of employee satisfaction has become an industry standard. It serves as a competitive advantage not only in the search for customers but also in the search for employees drawn to the company's positive work culture.
Customer Service Benchmarks for Better Customer Service
The importance and relevance of these benchmarks depend on the industry, business model, specific customer service goals, and the communication channels in use. Prioritizing benchmarks to align with the organization and customer service objectives helps measure and improve the quality of customer service interactions. Measure, review, and analyze the KPIs of customer service organization and operation. Compare, share, and celebrate customer service benchmarks and watch your customer support quality shine. Customer service KPIs measurement and monitoring of customer data have been proven to raise business success rates and improve support team performance.