Text. Your. Customers. If this concept makes you pause and ask why you have come to the right place. Recent texting statistics show that texting is no longer a purely personal communication channel. Customers like to text. And businesses that incorporate texting into their communication practices get ahead in the game.
How do we really know what the customers want? One sure way is to look at available data. Texting statistics provide a look at customer preferences. They show what works and what does not. For example, surveys show that open and SMS click-through rates are higher for text communication than other channels. For businesses that try to reach customers through personalized automated text messages that’s huge. Check out the compilation of a variety of business texting statistics below. See the evidence and reach teh results you want.

A Brief History of Text Messaging
Text messaging, or SMS, started in the early 1990s as a simple way to send short text-based messages between mobile devices. The first SMS, sent in 1992, said, “Merry Christmas.”
Initially capped at 160 characters and used for personal messages, SMS grew quickly for its reliability. Businesses later adopted it for marketing and customer service. Its ability to provide fast, direct, and personal communication made it a valuable tool for customer engagement and timely support. A mass texting tool like DialMyCalls helps businesses reach thousands of customers within seconds, offering personalization that enhances customer engagement and support.
Texting Statistics
A relatively new practice, business texting might seem intimidating. With diverse sources for these text message statistics, this data shows there is nothing to be afraid of.
Text message marketing statistics
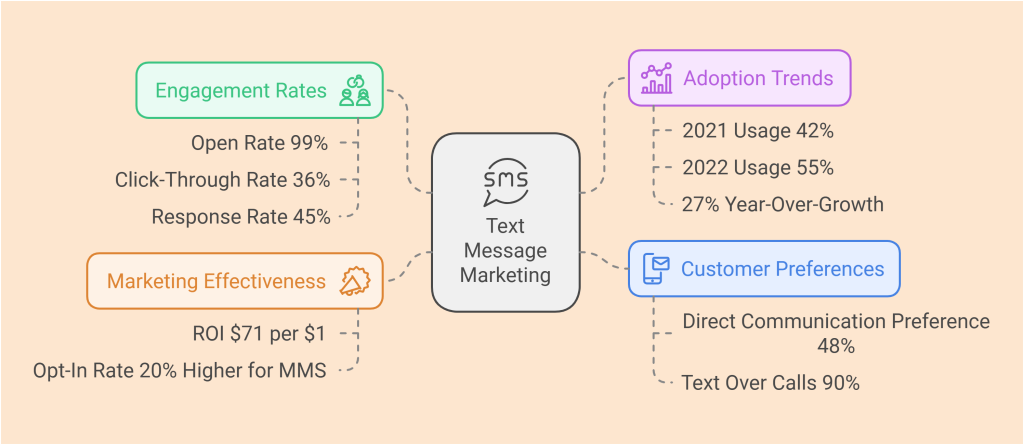
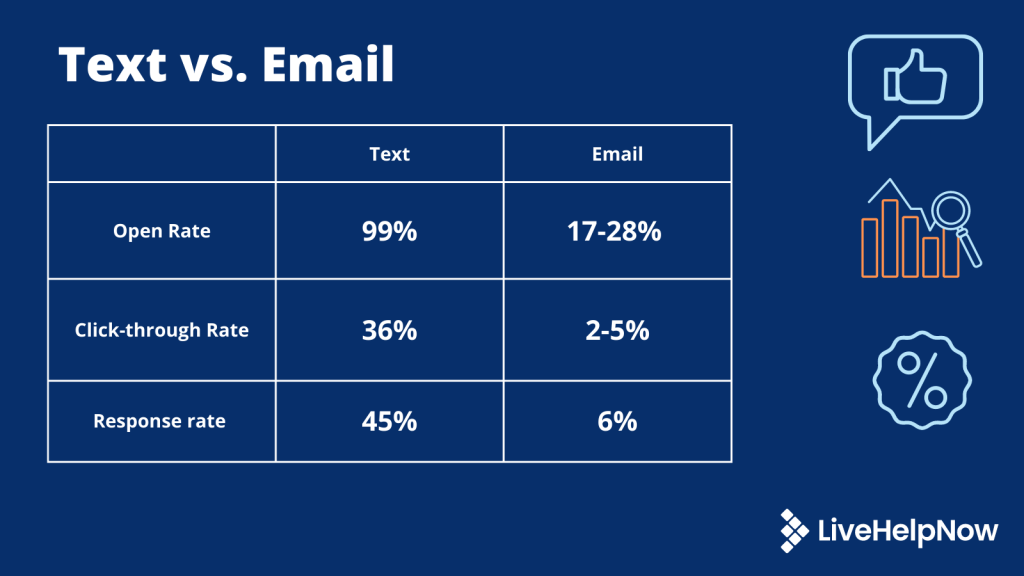
1. The open rate for text messages is 99%, whereas a good open rate for emails is between 17 and 28% (99Firms)
2. SMS marketing statistics show a 36% click-through rate (99Firms)
3. Marketing text messages: 48% of customers prefer direct communication from businesses through text messages (True List)
4. The SMS response rate is 45%, whereas for email it’s only 6% (Avochato)
5. SMS subscribers: A study showed that MMS had a 20% higher opt-in rate than SMS. (Adobe)
6. Highest text message volume: 98% of adults in the US own a mobile phone (SMS Comparison)
7. 90% of customers prefer text messages over direct phone calls (SMS Comparison)
8. SMS marketers generate $71 for every dollar spent (Luisa Zhou)
9. Text message volume: In 2021, 42% of business owners and digital marketers texted their customers using a text messaging service. In 2022, 55% of businesses use text message marketing with their customers, indicating a 27% year-over-growth in SMS adoption. (Simple Texting)
10. A Learn Hub study found that 31% of people would like more ways to communicate with businesses. With that in mind, marketing strategies that include multiple channels like email, social media marketing, and SMS are becoming more popular. (Blogging Wizard)

Generational Texting Behaviors1
11. Text is the most used form of communication for American adults under 50 (The Local Project)
12. Millennial mobile usage: 75% of Millennial and Gen Z Americans prefer to text rather than call (99firms)
13. 44% of people who actively text would prefer to press a button to initiate a text conversation instantly rather than just waiting on hold to speak with an agent. (Skipio)
14. The number of monthly texts sent increased more than 7,700% over the last decade. (Statistic Brain)
15. 91% of teens with cell phones actively text. (Pew Research Center)
16. 44% of Gen Z consumers check their text notifications within one minute of receiving a text––that’s 27% faster than the national average. (Simple Texting)
17. 20% of Gen Z consumers say they’re likely to use a text-to-buy functionality where they can make a purchase with a business directly through text. (Simple Texting)
Consumer behavior texting statistics
18. 78% of people wish they could have a text conversation with a business. (The Local Project)
19. 75% of people like offers sent via text (The Local Project)
20. More than 50% of consumers would prefer text messaging for customer support rather than phone calls. (Finances Online)
21. 89% of consumers say they prefer texting with businesses over any other mode of communication. (Avochato)
22. Over 60% of businesses still don’t use SMS. Get ahead of the game! (CallHub)
23. According to survey results, 1 in 3 consumers check their text notifications within one minute of receiving a text (Simple Texting)
24. Average response time: 85% of consumers check their texts within 1-5 minutes of receiving a text. (Simple texting)
25. Customer engagement: 61% of consumers say they want the ability to text a business back largely for things like appointments, reservations, and event reminders, as well as customer service. (Simple texting)
26. 62% of cellphone users check their devices for new messages immediately after waking up. (CallHub)
Customer Support Texting Statistics
27. 88% of customers want their order updates, reminders, and order confirmations sent as texts (Avochato)
28. 77% cited a positive experience with text-based intelligence assistants, followed by messaging apps (72%) (Statista)
29. As many as 66% of consumers say they would pay more for something if it were supported by a mobile messaging channel (CallHub)
30. 47% said that texting could improve their overall satisfaction with customer support. (Skipio)

Bottom Line
Texting statistics show that texting is the future of business and customer service. By implementing texting into your customer support strategy, companies can get ahead of the game. Serving customers through their preferred method of communication – texting – can help take customer support to teh next level.


